Introduction
If you don’t use Limit or Stop orders for both trade entry and exit then you will use market orders and of course these depend on the size of the Bid/Ask spread to determine what prices you receive.
When you hit the buy button, you actually buy at the ASK price which is a spread size above the bid price that you probably used to decide to buy.
When you hit the sell button, you actually sell at the BID price which is a spread size below the ask price.
Of course when you hit the close button to close a position that you had previously bought, you actually sell at the current BID price.
And the reverse is true, when you hit the close button to close a position that you had previously shorted, you actually buy back or cover at the current ASK price.
Now we can use tick data from MetaTrader 5 to analyze what the historic true average Bid/Ask spread actually have recently been.
You shouldn’t need to look at the current spread because that is available if you show both bid and ask price lines.
Let’s look at why and how
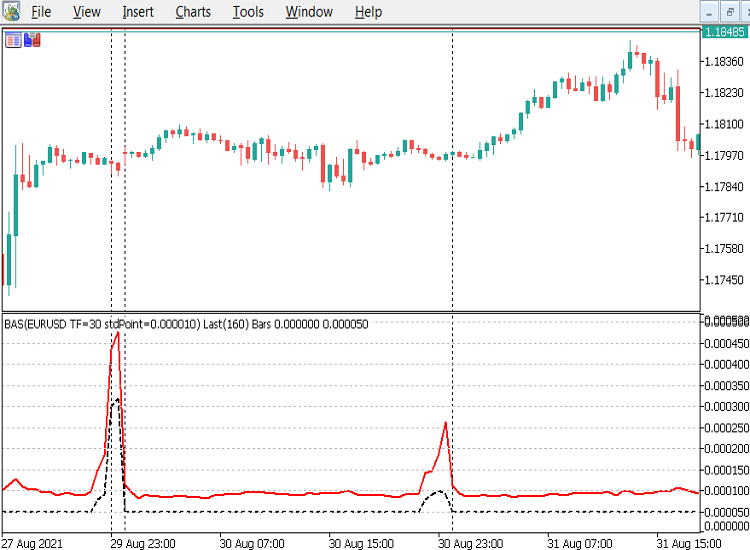
Looking at these charts, you can see that this broker says that most of the spreads are 5 points.
If that was the case then it should cost you 1 pip for the round trip of opening and closing a trade.
So, for a trade with a 1/1 reward risk ratio with a Stop Loss of 10pips and Take Profit of 10 pips, it should cost you 10% of your risk/stake.
This kind of spread is fair enough, for example a bookies over-round book is typically 15%, casinos profit margin is around 4%.
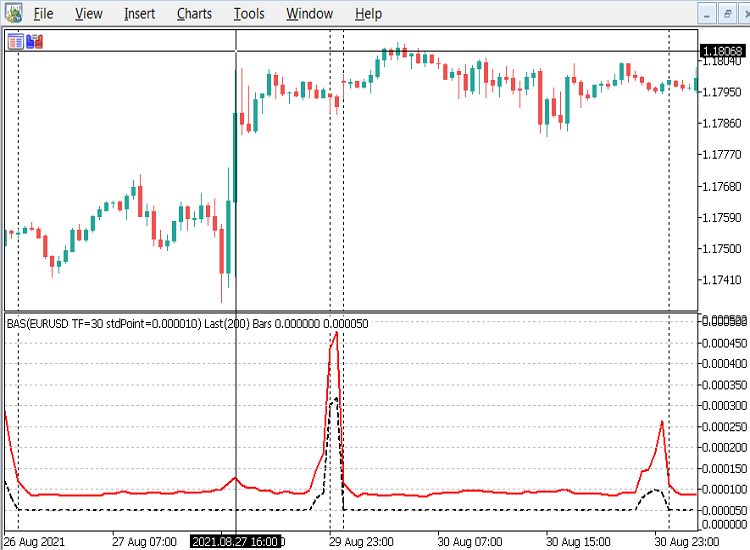
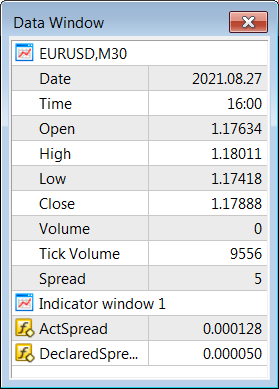
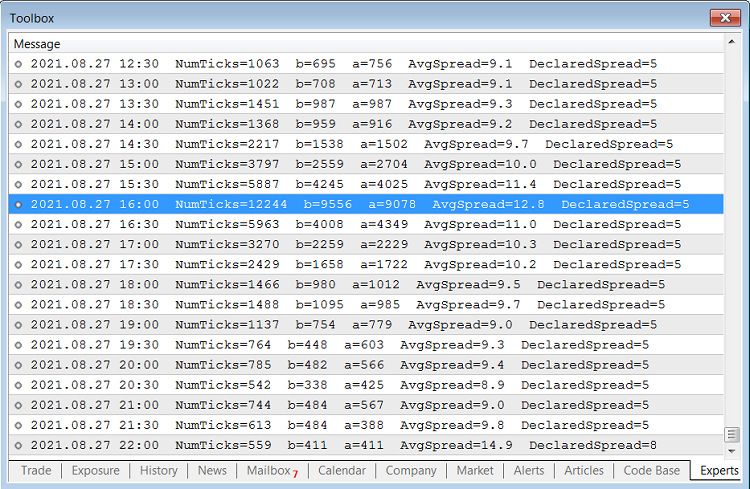
But, the actual average spreads, the red line, versus the brokers documented spread, (black dashed line) are mostly twice as large as the declared spread as confirmed by the data window below. Using the earlier example with the same SL & TP, the cost to you is normally at least 2pips or 20%.
If you are a smaller scale scalper, e.g. using SL of 5pips & TP 5pips, or if you decide to get out before the previous examples 10 pip SL or TP are hit, at say a 5pip loss, then the cost is the same 2 pips, but because you played safe after the trade started to go against you, the percentage cost is now 40% of your stake/risk.
When I was a newbie trader I started off using 5 pip S/l and 10 pip T/P for a 2:1 risk/reward ratio, (as I suspect many new traders do). I wasn’t very successful.
So I did a deep analysis of the EURUSD M1 chart with a reliable Zig Zag indicator. I set it to 5 pips as the minimum leg size, which for me signified the kind of retracement I could deal with.
The results seem to suggest that most small swings were around 7 pips and the 10 pip legs were relatively rare in comparison. Of course I allowed for news releases and volatile markets, so the results were from mainly average periods from the trading sessions only.
So, in consequence I started using a 10 pip stop loss and left the take profit open, so I could monitor the trade closely and decide when to get out if the trade had already hit a 7 pip loss or profit. This resulted in an improvement, but still left me short of a profit. It was only then that I noticed the high bid/ask spreads I was trading against with that broker, so of course looked for a better broker.
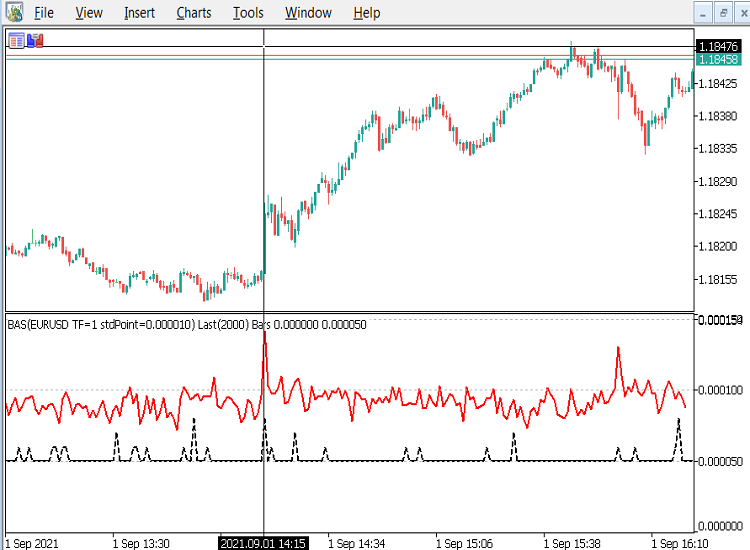
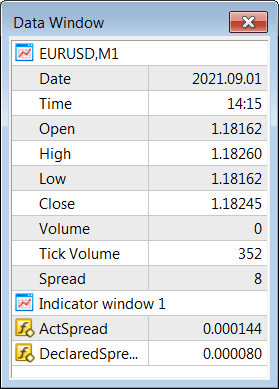
If you trade when news comes out or the market become volatile, you can see that the actual average spread goes up to around 15 points or 3 times the standard 5 points, so you have to pay 3pips or 60% of your stake.
Don’t even consider trading after 20:30 UK time (21:30 on chart server time), it could well be 4, 5, 6 times or even much higher, especially if you decide to hold onto your trading position over a weekend, which as you can see below is almost 10 times the standard 5 point spread, unless you have extremely large stop loss and take profit levels.
OnInit() Code example
#property indicator_separate_window

#property indicator_buffers 2
#property indicator_plots   2

//--- plots
#property indicator_label1  "ActSpread"
#property indicator_type1   DRAW_LINE
#property indicator_color1  clrRed
#property indicator_style1  STYLE_SOLID
#property indicator_width1  2

#property indicator_label2  "DeclaredSpread"
#property indicator_type2   DRAW_LINE
#property indicator_color2  clrBlack
#property indicator_style2  STYLE_DASH
#property indicator_width2  2

//--- indicator parameters
input int      numRecentBarsBack=100; //#RecentBarsBack M30+~100, M5~200, M1~500
input bool     doPrint=true;          //true=prints to the toolbox\experts log

//--- indicator buffers
double         ActSpreadBuf[], DeclaredSpreadBuf[];

//+------------------------------------------------------------------+
//| Custom indicator initialization function                         |
//+------------------------------------------------------------------+
int OnInit()
{
   int numBars=iBars(_Symbol,PERIOD_CURRENT)-2;

   // Check we have enough data for the request before we begin
   if(numRecentBarsBack>numBars)
   {
      Alert("Can't Do ", numRecentBarsBack, "! Only ",
               numBars, " Bars are Available",
               " try 100 or so for 30+ minute charts,",
               " 200 for 5 minute, or 500 for 1 minute charts.",
               " Otherwise the indicator may be too slow"
           );

      return(INIT_PARAMETERS_INCORRECT);
   }

   double sumPrice=0;
   double avgPrice=0;

   // Get the standard 5 point spread for the standard EURUSD currency
   double stdSpread=0.00005/iClose("EURUSD",PERIOD_M1,1); // 1.2 ~=  EURUSD std price

   //Find out the current average price of the instrument we are using, so we can standardise the spread and _Point
   int CheckAvgPriceBars=MathMin(numRecentBarsBack, 200);

   int i=0;
   for(; i<CheckAvgPriceBars; i++)
   {
      sumPrice+=iClose(_Symbol,PERIOD_CURRENT,i);
   }
   avgPrice=sumPrice/(i? i: 1.0);

   //convert the stdSpread to stdPoint by dividing by 5, so we compare  apples with apples, not oranges
   double stdPoint=StringToDouble(DoubleToString(avgPrice*stdSpread/5.0,6));

   Print(i, "=bars done, avgPrice=", DoubleToString(avgPrice,6),
            " std=", DoubleToString(1.2*stdSpread, 6),
            " stdPoint=", DoubleToString(stdPoint, 6)
         );

   SetIndexBuffer(0,ActSpreadBuf,INDICATOR_DATA);
   SetIndexBuffer(1,DeclaredSpreadBuf,INDICATOR_DATA);

   string indName ="BAS("+_Symbol;
          indName+=" TF="+string(_Period);
          indName+=" stdPoint="+DoubleToString(stdPoint, 6);
          indName+=") Last("+string(numRecentBarsBack)+") Bars";

   IndicatorSetString(INDICATOR_SHORTNAME, indName);

   IndicatorSetInteger(INDICATOR_DIGITS,6);

   IndicatorSetDouble(INDICATOR_MINIMUM, 0.0);

   IndicatorSetInteger(INDICATOR_LEVELS, 20);

   //mark out each standard EURUSD 5 point spread, to compare this currencies spread with EURUSD
   IndicatorSetDouble(INDICATOR_LEVELVALUE,0,  0.000000);
   IndicatorSetDouble(INDICATOR_LEVELVALUE,1,  5*stdPoint);
   IndicatorSetDouble(INDICATOR_LEVELVALUE,2, 10*stdPoint);
   IndicatorSetDouble(INDICATOR_LEVELVALUE,3, 15*stdPoint);
   IndicatorSetDouble(INDICATOR_LEVELVALUE,4, 20*stdPoint);
   IndicatorSetDouble(INDICATOR_LEVELVALUE,5, 25*stdPoint);
   IndicatorSetDouble(INDICATOR_LEVELVALUE,6, 30*stdPoint);
   IndicatorSetDouble(INDICATOR_LEVELVALUE,7, 35*stdPoint);
   IndicatorSetDouble(INDICATOR_LEVELVALUE,8, 40*stdPoint);
   IndicatorSetDouble(INDICATOR_LEVELVALUE,9, 45*stdPoint);
   IndicatorSetDouble(INDICATOR_LEVELVALUE,10,50*stdPoint);
   IndicatorSetDouble(INDICATOR_LEVELVALUE,11,55*stdPoint);
   IndicatorSetDouble(INDICATOR_LEVELVALUE,12,60*stdPoint);
   IndicatorSetDouble(INDICATOR_LEVELVALUE,13,65*stdPoint);
   IndicatorSetDouble(INDICATOR_LEVELVALUE,14,70*stdPoint);
   IndicatorSetDouble(INDICATOR_LEVELVALUE,15,75*stdPoint);
   IndicatorSetDouble(INDICATOR_LEVELVALUE,16,80*stdPoint);
   IndicatorSetDouble(INDICATOR_LEVELVALUE,17,85*stdPoint);
   IndicatorSetDouble(INDICATOR_LEVELVALUE,18,90*stdPoint);
   IndicatorSetDouble(INDICATOR_LEVELVALUE,19,95*stdPoint);

return(INIT_SUCCEEDED);
}
For this simple 2 plot indicator there are only 2 parameters, the first ‘numRecentBarsBack’ is for how many bars we want analysed.
The first thing we do in OnInit() is do a check that we have enough data to satisfy the request, if we haven’t then we alert the user and suggest some realistic values to use, then exit the indicator early with an error.
The rest of OnInit() is fairly standard except for the levels used in the indicator sub-window, which are set to values that correspond to multiples of the standard EURUSD 5 point spread.
This is a fairly important step because as well as wanting to see the comparison between the declared and actual average spread values, we want to also see how big the spread of different currencies are as compared with the standard EURUSD, which normally has the lowest available spread of all the currencies.
This is a fairly convoluted method because we have to get the current EURUSD price (and substitute 1.2 if it doesn’t exist) and use 5 EURUSD points divided by that price to build a standard spread. Then we iterate through numRecentBarsBack prices of the current Forex instrument, (I haven’t tested it with non-forex instruments) to get an average price of that instrument.
When we have the instruments average price, we then build a rounded standard point by multiplying the instruments average price by the previously built standard spread and dividing by 5, the standard EURUSD point of spread.
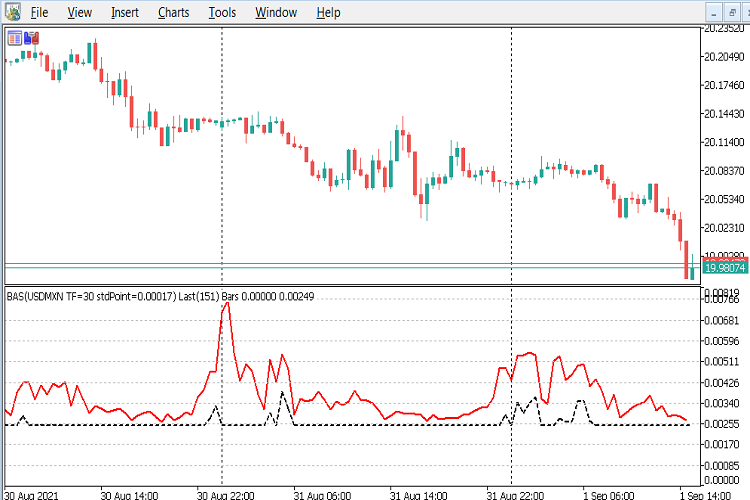
This rounded standard point is then used in each level value and is also included in the indicators short name, as can be seen within the indicators name in the ‘exotic’ USDMXN chart below.
In this USDMXN example the trading daytime declared spread is around 0.0025 which is about 3 spread levels up from the zero so corresponds to around 15 points in a EURUSD chart. Also note that the actual average spread varies wildly above even that high level for this broker.
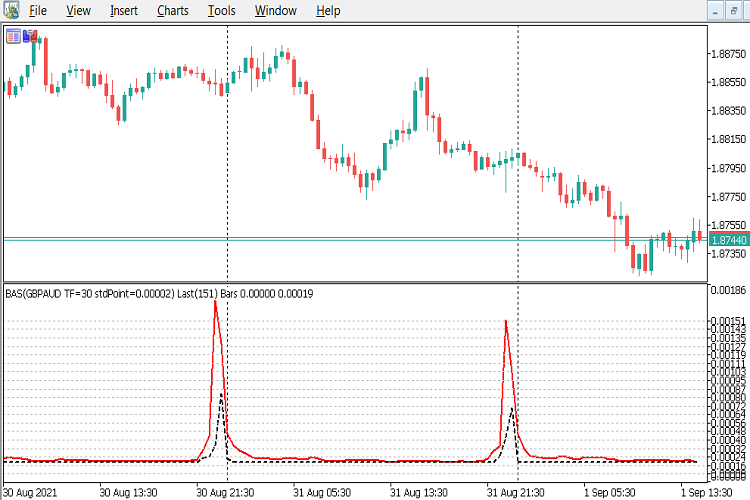
The GBPAUD chart below shows that the trading daytime declared spread is around 0.00019 which is about 2.5 spread levels up from the zero so corresponds to around 12 points in a EURUSD chart. Also note that in this chart the actual average spread values are fairly close to the declared values for this broker.
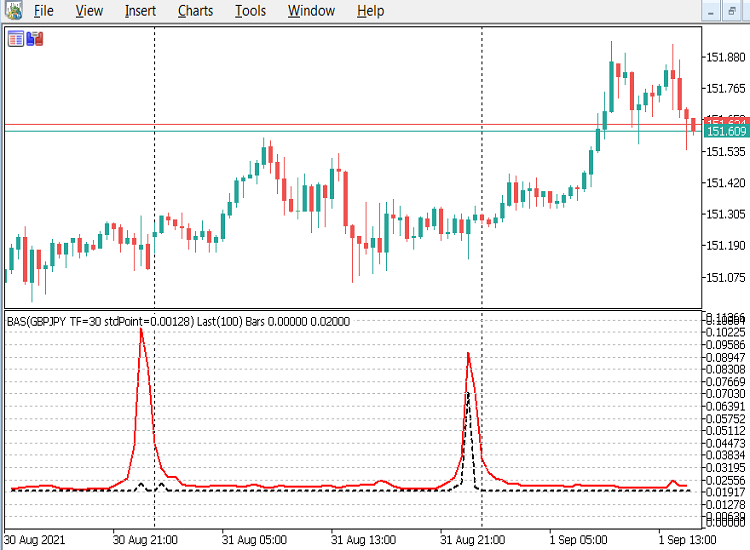
The GBPJPY chart below shows that the trading daytime declared spread is around 0.020 which is about 3 spread levels up from the zero so corresponds to around 15 points in a EURUSD chart. Also note that in this chart the actual average spread values are fairly close to the declared values again for this broker.
The USDJPY chart below shows that the trading daytime declared spread is around 0.0050 which is roughly only 1 spread level up from the zero level so corresponds to around the standard 5 points in a EURUSD chart. Also note that in this chart the actual average spread values are again roughly double the declared values, so the same comments as the EURUSD risk/reward percentage levels also apply here.
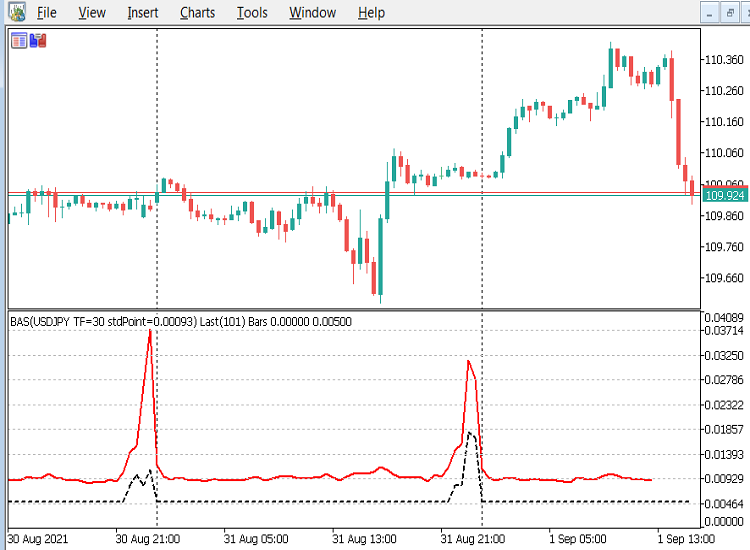
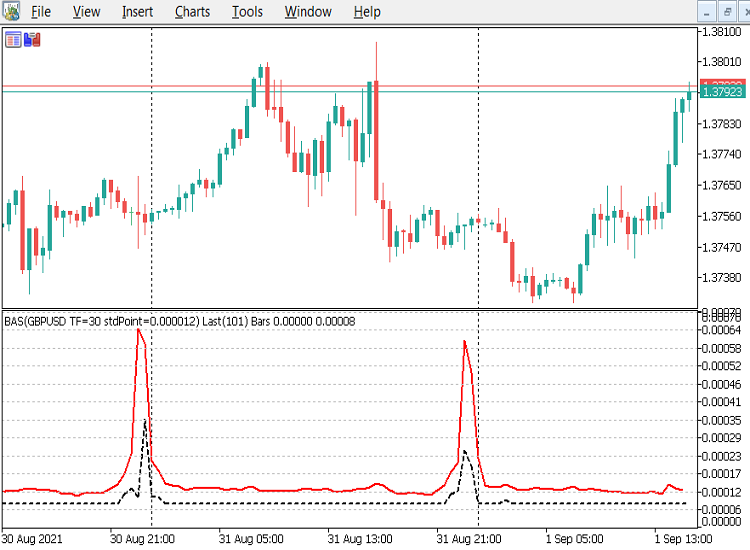
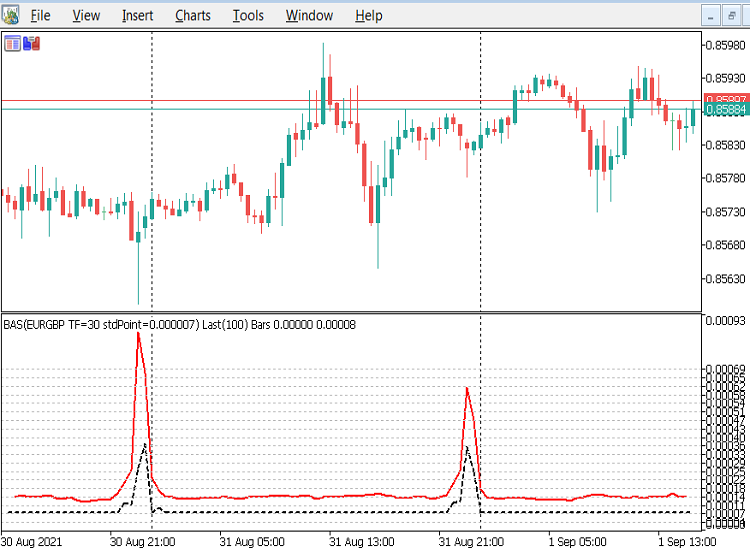
Here are a few more examples, you can make your own assessments about the relationships between the spreads levels.
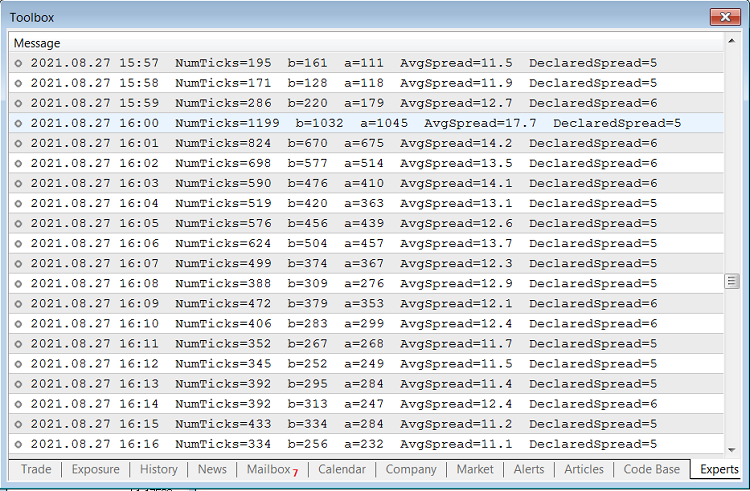
The second parameter is the boolean ‘doPrint’, which is checked in the code and if true will print the individual bars stats to the experts log as the examples below demonstrate. This can slow the indicator down if the value of ‘numRecentBarsBack’ is too large, so the default value is 100.
if you set the ‘doPrint’ parameter to true and ‘numRecentBarsBack’ to a reasonable value of somewhere around 100 for a 30 minute chart or 300 for a 1 minute chart, then you can copy the log entries and send them to your broker as proof of their true Bid/Ask spreads.
OnCalculate() Code Example
//--- Global variables
//--- Set the date formatting for printing to the log
const uint dtFormat=uint(TIME_DATE|TIME_MINUTES);

//+------------------------------------------------------------------+
//| Custom indicator iteration function                              |
//+------------------------------------------------------------------+
int OnCalculate(const int rates_total,
                const int prev_calculated,
                const datetime &time[],
                const double &open[],
                const double &high[],
                const double &low[],
                const double &close[],
                const long &tick_volume[],
                const long &volume[],
                const int &spread[])
{
   //--- Check for no data or Stop flag before we begin
   if(_StopFlag || rates_total<2)
   {
         Alert("Error, StopFlag=", _StopFlag, " #Bars=", rates_total);
         return(rates_total);
   }

   //only do the report at indicator start up or refresh
   if(prev_calculated>2)
   {
      // if we have already nulled the ActSpreadBuf just do the DeclaredSpreadBuf[] and return.
      if(prev_calculated==rates_total)
      {
         int currBar=rates_total-1;
         DeclaredSpreadBuf[currBar]=spread[currBar]*_Point;
         return(rates_total);
      }
      // else its the start of a new bar so null the ActSpreadBuf
      else
      {
         int currBar=rates_total-1;
         ActSpreadBuf[currBar]=EMPTY_VALUE;
         return(rates_total);
      }
   }


   static int start=rates_total-numRecentBarsBack;

   MqlTick tickBuf[];

   double sumSpread=0;
   double thisSpread=0;

   int ticks=0;
   int bid_tick=0;
   int ask_tick=0;
   int k=0;

   ArrayInitialize(ActSpreadBuf, EMPTY_VALUE);
   ArrayInitialize(DeclaredSpreadBuf, EMPTY_VALUE);

   for(int i=start; i<rates_total; i++)
   {
      sumSpread=0;
      thisSpread=0;
      bid_tick=0;
      ask_tick=0;
      k=0;

      ticks=CopyTicksRange(_Symbol, tickBuf,
                           COPY_TICKS_INFO, // Only bid and ask changes are required
                           time[i-1]*1000,  // Start time of previous bar
                           time[i  ]*1000   // End time of previous bar
                           );

      while(k<ticks)
      {
         if((tickBuf[k].flags&TICK_FLAG_ASK)==TICK_FLAG_ASK)
            ask_tick++;

         if((tickBuf[k].flags&TICK_FLAG_BID)==TICK_FLAG_BID)
            bid_tick++;

         sumSpread+=tickBuf[k].ask-tickBuf[k].bid;

         k++;
      }

      // Ensure no divide by zero errors for any missing tick data
      if(ticks>0) {
         thisSpread=sumSpread/ticks;
         ActSpreadBuf[i-1]=thisSpread;
      }
      else  {
         thisSpread=0.0;
         ActSpreadBuf[i-1]=EMPTY_VALUE;
      }

      DeclaredSpreadBuf[i-1]=spread[i-1]*_Point;

      if(doPrint)
      {
                  Print(TimeToString(time[i-1], dtFormat),
                  "  NumTicks="+string(ticks),
                  "  b="+string(bid_tick),
                  "  a="+string(ask_tick),
                  "  AvgSpread=",  DoubleToString(thisSpread/_Point, 1),
                  "  DeclaredSpread=", string(spread[i-1])
                  );
      }

   }

   //don't do stats for incomplete current bar, but can do DeclaredSpread if it has a value
   DeclaredSpreadBuf[rates_total-1]=(spread[rates_total-1]*_Point);

//--- return value of prev_calculated for next call
return(rates_total);
}
From the above OnCalculate() example, the main point to note is the use of CopyTicksRange() to only get the tick data between the start of the previous indexes bar/candle and the start of the current indexes bar/candle. Also note that we have to convert the time[] array to milliseconds by multiplying it by 1000 because datetime data is only accurate down to the second, and CopyTicksRange() requires milliseconds.
ticks=CopyTicksRange(_Symbol, tickBuf,
                           COPY_TICKS_INFO, // Only bid and ask changes are required
                           time[i-1]*1000,  // Start time of previous bar
                           time[i  ]*1000   // End time of previous bar
                           );
Also note that we accumulate the bid and ask ticks, although we don’t use them in the plots. The value of bid ticks should match the value in the tick_volume[] array, and does as shown in the Data Window.
Extra note about downloading ticks…
If you want to check a currency that you don’t normally use, you will need to add that currency from the View\Symbols menu item by double clicking it to Show Symbol. Whilst in this window you should also go to the ticks tab and request All ticks a date a month or so before today in the first date menu; and then set the second date menu to tomorrow to seed your local ticks database.
Conclusion
Before we trade a currency we should know what our risk percentages are for the type of trading (scalping, swing, position…) we are considering and compare those of our favourite currencies with others available using a common standard spread size .
From my studies, I would advise traders to stick to the major currencies that are directly attached to the USD, namely USDCAD, USDCHF, USDJPY, EURUSD and GBPUSD; as they have the lowest overall spreads.
We all need to let our brokers know that we can now see their true Bid/Ask spreads, even if we are trading commission only, if they increase their spreads to very high levels. Good luck, and remember don’t trade if you can’t find a broker with reasonable Bid/Ask spreads during the trading hours, as you CANNOT win!
Before anyone asks, this process can only be run against MetaTrader 5 because the tick data is not available in MetaTrader 4, so it’s a good reason to upgrade.